import pandas as pd
Data Warehouse/Pipeline
The data warehouse/pipeline was built utilizing Python and Google Cloud Platform's cloud resources. This pipeline is utilized for storage, transformation and reporting on the data for multiple teams in our company.
Resources
The following resources are used to create the pipeline:
- Python
- GitLab
- Google Sheets
- Google Cloud Functions
- Google Cloud Scheduler
- Google Pub/Sub
- Google BigQuery
- Google Cloud Storage
- Google Data Studio (Looker Studio)
This pipeline is illustrated in the following diagram:
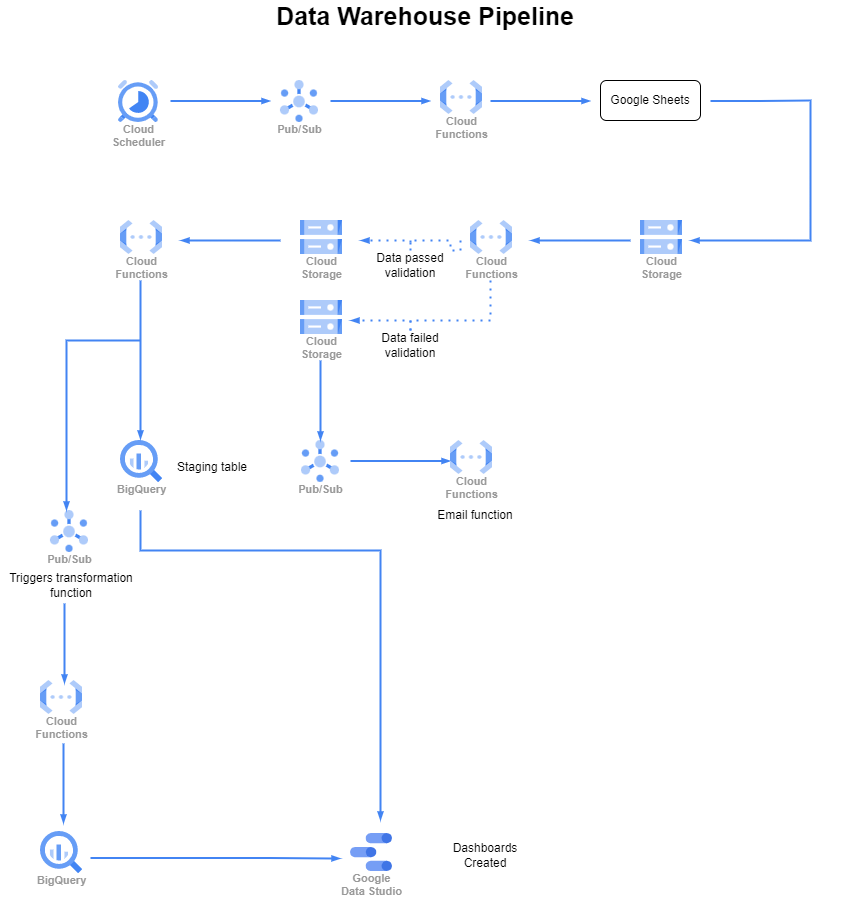
Pipeline Details
The pipeline includes multiple steps, sets of functions and validations of the data that result in a data warehouse with clean, reliable data used for visualizations and reports.
Data Creation
The data included in the pipeline comes from two different sources. Data is either entered into Google Sheets by our team members, or we are provided data from our client partner's databases. In the case of the former, each team member has a Google Sheet specific to their team's tracking needs. Data is filled out on the individual sheets and then compiled into a single, main sheet, utilizing the Query and Importrange functions available in Google Sheets.
Data Ingestion
When data is compiled into a single Google Sheet, the ingestion occurs by utilizing Google Cloud Scheduler to send a Pub/Sub message. This message is a trigger for a Google Cloud Function that reads data from the main Google Sheet, converts it to a pandas dataframe, and loads a .csv file into a Google Cloud Storage bucket.
If data is provided directly to us by the client partner, the file format will determine how this is ingested. If the file is a .csv, it is loaded directly into a Cloud Storage bucket using the raw prefix. If the file is in the .xlsx format, it is loaded into a Cloud Storage bucket using the prep prefix. The prep prefix triggers a function that reads the Excel file into a pandas dataframe before loading it as a .csv to the Cloud Storage bucket.
Data Validation
Once the initial data is into the Cloud Storage bucket, a new Cloud Function is triggered that runs data validation on the respective data using the Great Expectations python library. The data is read into the function with custom validations run against the data to test things such as whether a column is null, if the columns match the expected set of columns, and if the values in a column match the expected values.
If the data fails this test, the Storage object is moved back to the Storage bucket in a folder prefixed as bad. The placement of the file in the bad prefix triggers a new Cloud Function to run that sends an email with a signed URL for the data validation documents. This allows the data team to investigate the data failure before the data ends up in the data warehouse.
If the data passes the validation tests, the Storage object is moved back to the Storage bucket in a folder prefixed as good.
Loading data to BigQuery
Once the data has passed validation, a Cloud Function is triggered that transforms the data to load it into a BigQuery staging table. Depending on the dataset, there will be some transformation work happening on the data to ensure proper formats for dates, numbers, etc. This section of the pipeline includes some data cleaning as well, including column name updates, switching data types, and cleaning up null values. Some examples of these functions are shown below:
def remove_space_in_column_names(df: pd.DataFrame) -> pd.DataFrame:
    """remove_space_in_column_names replaces the space in a column's
    name with an underscore. This function is intended for situations
    where the column name only needs spaces removed

    Args:
        df (pd.DataFrame): the dataframe to perform the operation

    Returns:
        pd.DataFrame: the transformed dataframe
    """
    try:
        for col in df.columns:
            df.rename(columns={col: col.replace(" ", "_")}, inplace=True)
        logger.info(f'Column names - {df.columns}')
    except Exception as e:
        logger.warning(f'Unable to rename column - {e}')
    return df
def change_data_type(df: pd.DataFrame,
                     cols: list,
                     data_type: str) -> pd.DataFrame:
    """change_data_type allows you to change the datatype
    of any column within your dataframe

    Args:
        df (pd.DataFrame): the dataframe to adjust
        cols (list): the columns to change the data type for
        data_type (str): the desired output data type.

    Returns:
        pd.DataFrame: the adjusted dataframe
    """
    try:
        for col in cols:
            df[col] = df[col].astype(data_type)
    except Exception as e:
        logger.warning(f'Unable to change datatype - {e}')
    return df
These functions allow for ensuring that the data is captured in a usable format for the ensuing reports and/or functions that will occur.
Depending on the dataset, once the data is transformed and placed in a BigQuery table, a Pub/Sub is sent on to a new Cloud Function to begin the next steps.
Data Transformations
Some of the data used in our reporting requires the combining of multiple datasets into a single staging table. This work is done by a Cloud Function that is triggered by the aforementioned Pub/Sub message sent out at the end of the initial BigQuery table creation.
The transformations include grouping data into different time periods, combining multiple staging tables into single tables, and creating new columns for averages, sums, etc. This work results in data ready for reporting that pulls together the various datasets for a given team. Some of the functions created and used for this work include:
def assign_new_column_average(df: pd.DataFrame,
                              new_column_name: str,
                              col_a: str,
                              col_b: str) -> pd.DataFrame:
    """assign_new_column_average calculates an average value
    using the two given columns. This generates a new column
    in the dataframe with the average

    Args:
        df (pd.DataFrame): the dataframe to use
        new_column_name (str): the name of the new column
        col_a (str): the numerator column to calculate the average
        col_b (str): the denominator column to calculate the average

    Returns:
        pd.DataFrame: the dataframe with the new average column
    """
    try:
        df[new_column_name] = (df[col_a]/df[col_b])
        logger.info(f'Created {new_column_name} dataframe')
    except Exception as e:
        logger.warning(f'Unable to create average column - {e}')
    return df
def assign_new_column_percent(df: pd.DataFrame,
                              new_column_name: str,
                              col_a: str,
                              col_b: str
                              ) -> pd.DataFrame:
    """assign_new_column_diff takes a given dataframe, along
    with 2 columns and the new column name. This function
    adds a column to the given dataframe by subtracting
    the value of col_b from the value of col_a. If a datatype
    is given the new column is cast as that type.

    Args:
        df (pd.DataFrame): the dataframe where a column
        will be added
        new_column_name (str): the name of the column being created
        col_a (str): the numerator
        col_b (str): the denominator

    Returns:
        pd.DataFrame: the original dataframe with the new column
    """
    try:
        df[new_column_name] = (df[col_a]/df[col_b])*100
    except Exception as e:
        logger.warning(f'Unable to assign new column - {e}')
    return df
Data Reporting
Upon the completion of the work to load, validate and transform the data, reporting is created utilizing Google Data Studio. This allows the team leads to access data in an interactive dashboard, giving them clean visuals and easy access to the data necessary to manage their teams.